Comparison of In-Situ and Satellite Measurements of Sea Surface Salinity in Coastal Southern California
Keywords:
- Satellite,
- Sea surface,
- Coastal area,
- Southern California,
- Oceanography
Abstract
Our objective is to determine to what extent coastal Sea Surface Salinity (SSS) data represents offshore SSS measurements. Offshore time series of SSS from ships are sparse because of ship-related costs and now widely available global satellite measurements exclude the area within about 25 km of the coast. Our dataset will be used to evaluate satellite SSS measurements with the aim of guiding improvements of satellite instruments to measure coastal SSS.
SSS variations in the coastal ocean influence climate, fisheries and water quality, including pH. Increase in SSS causes surface water to sink with associated upwelling in adjacent regions. Upwelling of colder, nutrient rich water can offset some anthropogenic-generated atmospheric warming and enhance plankton production, boosting fisheries.
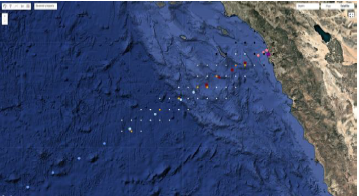
We use daily Shore Stations Program data from Scripps Institution of Oceanography (SIO/UCSD) pier and California Cooperative Oceanic Fisheries Investigations (CalCOFI) ship data from 1985-2020. CalCOFI data are seasonal from 3-4 cruises per year at 15 stations along Line 93.3 trending 240° True extending from about 3 km to 750 km offshore of Del Mar, CA, about 11 km north-northwest of SIO. Daily SSS measurements have been recorded at SIO pier since 1916. Beginning in 1950 CalCOFI operated ship surveys at 3-4 months intervals to monitor the coastal ecosystem off the west coast. Operations were intermittently reduced in frequency and geographic extent for lack of funding, becoming irregular after 2020.
The 35-year average SSS at SIO pier was 33.54 Practical Salinity Units (PSU). Within 200 km of the coast, average SSS salinity is 0.04 PSU lower (fresher) than SIO pier with high R² coherence of 0.81. Measurement uncertainty is about ±0.002 PSU. This area is the Southern California Bight that lies in the “shadow” of Point Conception with intermittent eddy-like northward counter flow to the farther offshore south-flowing California Current.
We contain our analysis within 200 km of the coast since coastal influences such as freshwater signatures from rivers and runoff don’t extend past 50 km offshore. Coastal fisheries and coastal ecosystems including kelp forests are generally contained within 200 km of the coast, including the Channel Islands. Beyond 200 km, satellite data is very representative of ocean conditions.
Downloads
Published
Issue
Section
DOI:
https://doi.org/10.56147/jasa.1.1.011Dimensions
License
Copyright (c) 2026 James Halpern, Reinhard Flick (Author)

This work is licensed under a Creative Commons Attribution-NonCommercial-ShareAlike 4.0 International License.
